There's a fair literature in AI on the question of inferring causality from a model represented as a Bayesian graph (in their many variants). What, however, is a robot to do when its knowledge representation is in the form of dynamical systems?
The brute-force way to do this is to search over the space of all matrices M where the robot's model of the world is is expressed as a transfer function of the state vector x:
We get a heuristic from the idea that if there are two things that are correlated, and you want to find which of them is the cause and which the effect (if any), check for the correlation of the absolute value of one with changes (i.e. the derivative) of the other.
For example, the angle of the accelerator pedal in my car is correlated with the car's speed. Which is the cause, which the effect? If we compare the acceleration of the car to the angle of the pedal, there are a lot more times it's speeding up and the pedal is floored, and a lot more times when it's slowing down and my foot is off the pedal, than the reverse. I.e. there's a correlation between the cause and the derivative of the effect. On the other hand, there isn't much of a correlation between the actual speed of the car and the rate of change in the angle of the pedal (because of course that's caused by curves and traffic lights and the sight of traffic cops and other external factors).
A slightly different example: imagine you're sticking your hand out of the window and feeling the wind. To be precise assume you're holding a wind-speed meter in your hand, and keeping another eye on the speedometer. They're correlated, with an "unexplained" variation that is due to the fact that the (real) wind is gusting. But in this case neither is causing the other; both readings are measures of the same thing, the motion of the car. There won't be any particular correlation between either and the derivative of the other.
Suppose, however, we happen to be riding in a sailboat. In this case there is a causal link between wind and the boat's speed. Again, wind speed and boat speed are correlated. But now you'll find a correlation between the absolute value of wind and the acceleration of the boat. Once you've noticed this, of course, you can go back and fit a considerably more detailed model to the dynamics, perhaps discovering a water-drag on the boat proportional to the square of its speed, for example.
This is by no means an infallible test of causality, but since we can apply it in both directions and compare the results, it can give us a strong hint in some cases. For the robot trying to build a model of its world, it is a relatively inexpensive "feeler" that tells us where it will be promising to do the computationally demanding search to fit a dymamical model.
I found a fascinating example of this while playing around on Paul Clark's excellent Wood for Trees site. The question here is whether atmospheric CO2 levels are driving global temperature, or vice versa. There are credible models of causality in either direction -- CO2 can drive temperature by the greenhouse effect, and temperature can drive CO2 levels by changing the solubility of CO2 in the oceans. Both of these mechanisms are compatible with the observed correlation of CO2 and global average temperature.
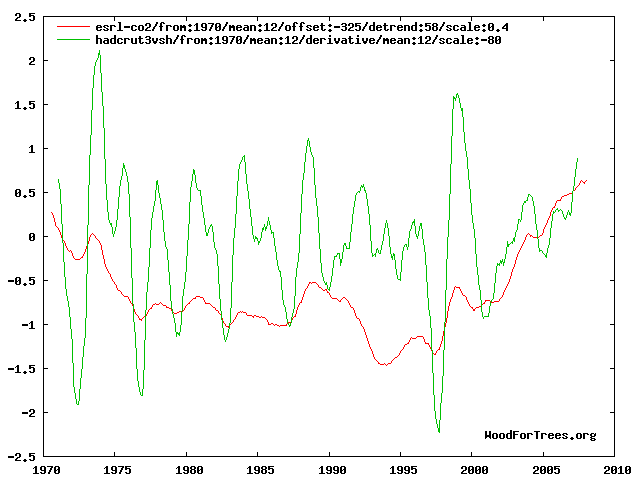
Here's a graph that matches CO2 with the derivative of temperature. There are some hints of a match, and it turns out to have a coefficient of determination (R2) of 0.085.

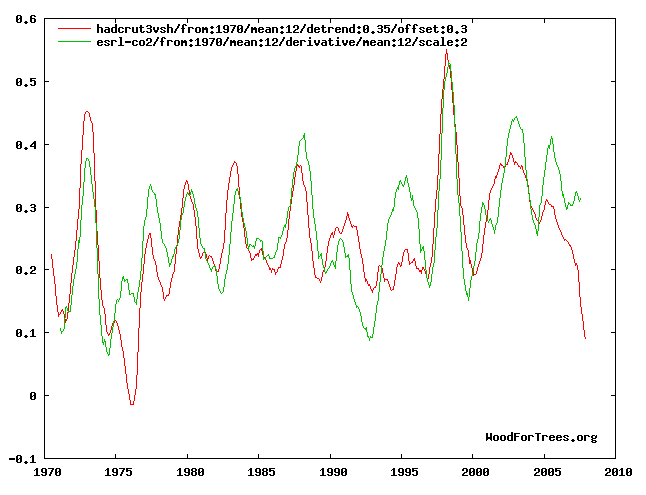
The graph for temperature vs. derivative of CO2, however, looks like quite a better match. It has an R2 of 0.569, more than 6 times as high. This supports the inference that causality primarily runs from ocean temperature to CO2 levels rather than vice versa.

Note that in the case of the climate, there is the possibility (indeed a probability) of a positive feedback loop, albeit a small one. In the transfer function matrix model, that is readily accomodated, simply by including the appropriate coefficients in the matrix. Ideally, we'd just use the R2's as initial guesses and hillclimb the matrix to the best fit with whatever data we had. But there are complications.
For the examples above, I matched the curves by hand -- this involves shifting, scaling, and detrending. An AI would have to do this automatically. One might think that this could be done by normalizing for the mean and standard deviation of each series and then subtracting off the regression lines. However, consider the following example, also from climate data:

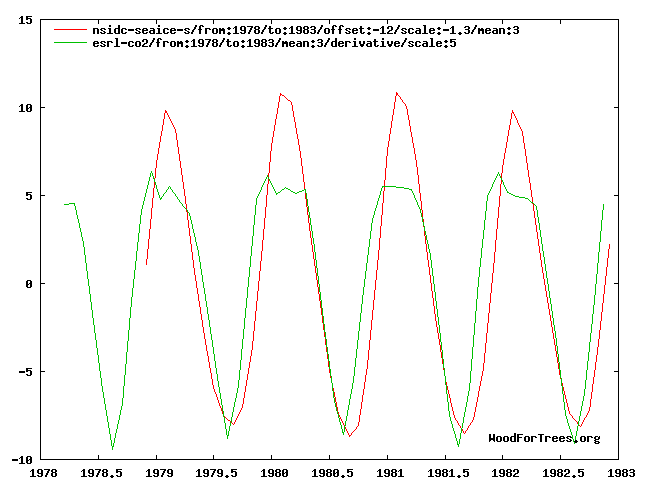
In this case the derivative of CO2 is plotted against southern sea ice (scaled negatively so that it's a proxy for ocean temperature). In this case it's only averaged quarterly so the annual variations aren't smoothed out. Again a nice fit -- but notice that the d(CO2) curve appears to be clipped about 3/4 the way up.
Our intuitive notion of causality says there are two things happening here: something that we might model as a process link limited by something we might model as a bottleneck. The point for model-building is that we can't use standard curve-fitting. In order to pick out phenomena like this, we need to match the curves so that the parts that fit closely "stick together" and the places where they wander off are ignored, to be explained by some other mechanism. Standard least-squares fitting does the opposite: it gives the most weight to the outliers. Hence my current research focus is to find ways to do that matching automatically.
(By the way, you shouldn't take any of this as proof of any given theory of CO2 levels in the real world. In particular, the southern ocean temps are strongly (negatively) correlated with warm northern temps, and thus with plant growth, which sucks CO2 out of the air like gangbusters. So is it cold southern water or warm northern plants? Or both? The heuristic doesn't help here and you have to do some real science...)